
If you work in AP or bookkeeping, you already know the truth: the “total” is where problems hide. It’s not that people can’t add. It’s that spreadsheets get messy: columns shift, a filter hides rows, or a report export shows numbers that “look right” until you actually tie them out.
Beyond just avoiding errors, these checks are about creating an audit trail. When a manager or auditor asks, "How do we know this export is complete?", you shouldn’t point to a vibe—you should point to a system.
Step 0: The "Control Panel" Strategy
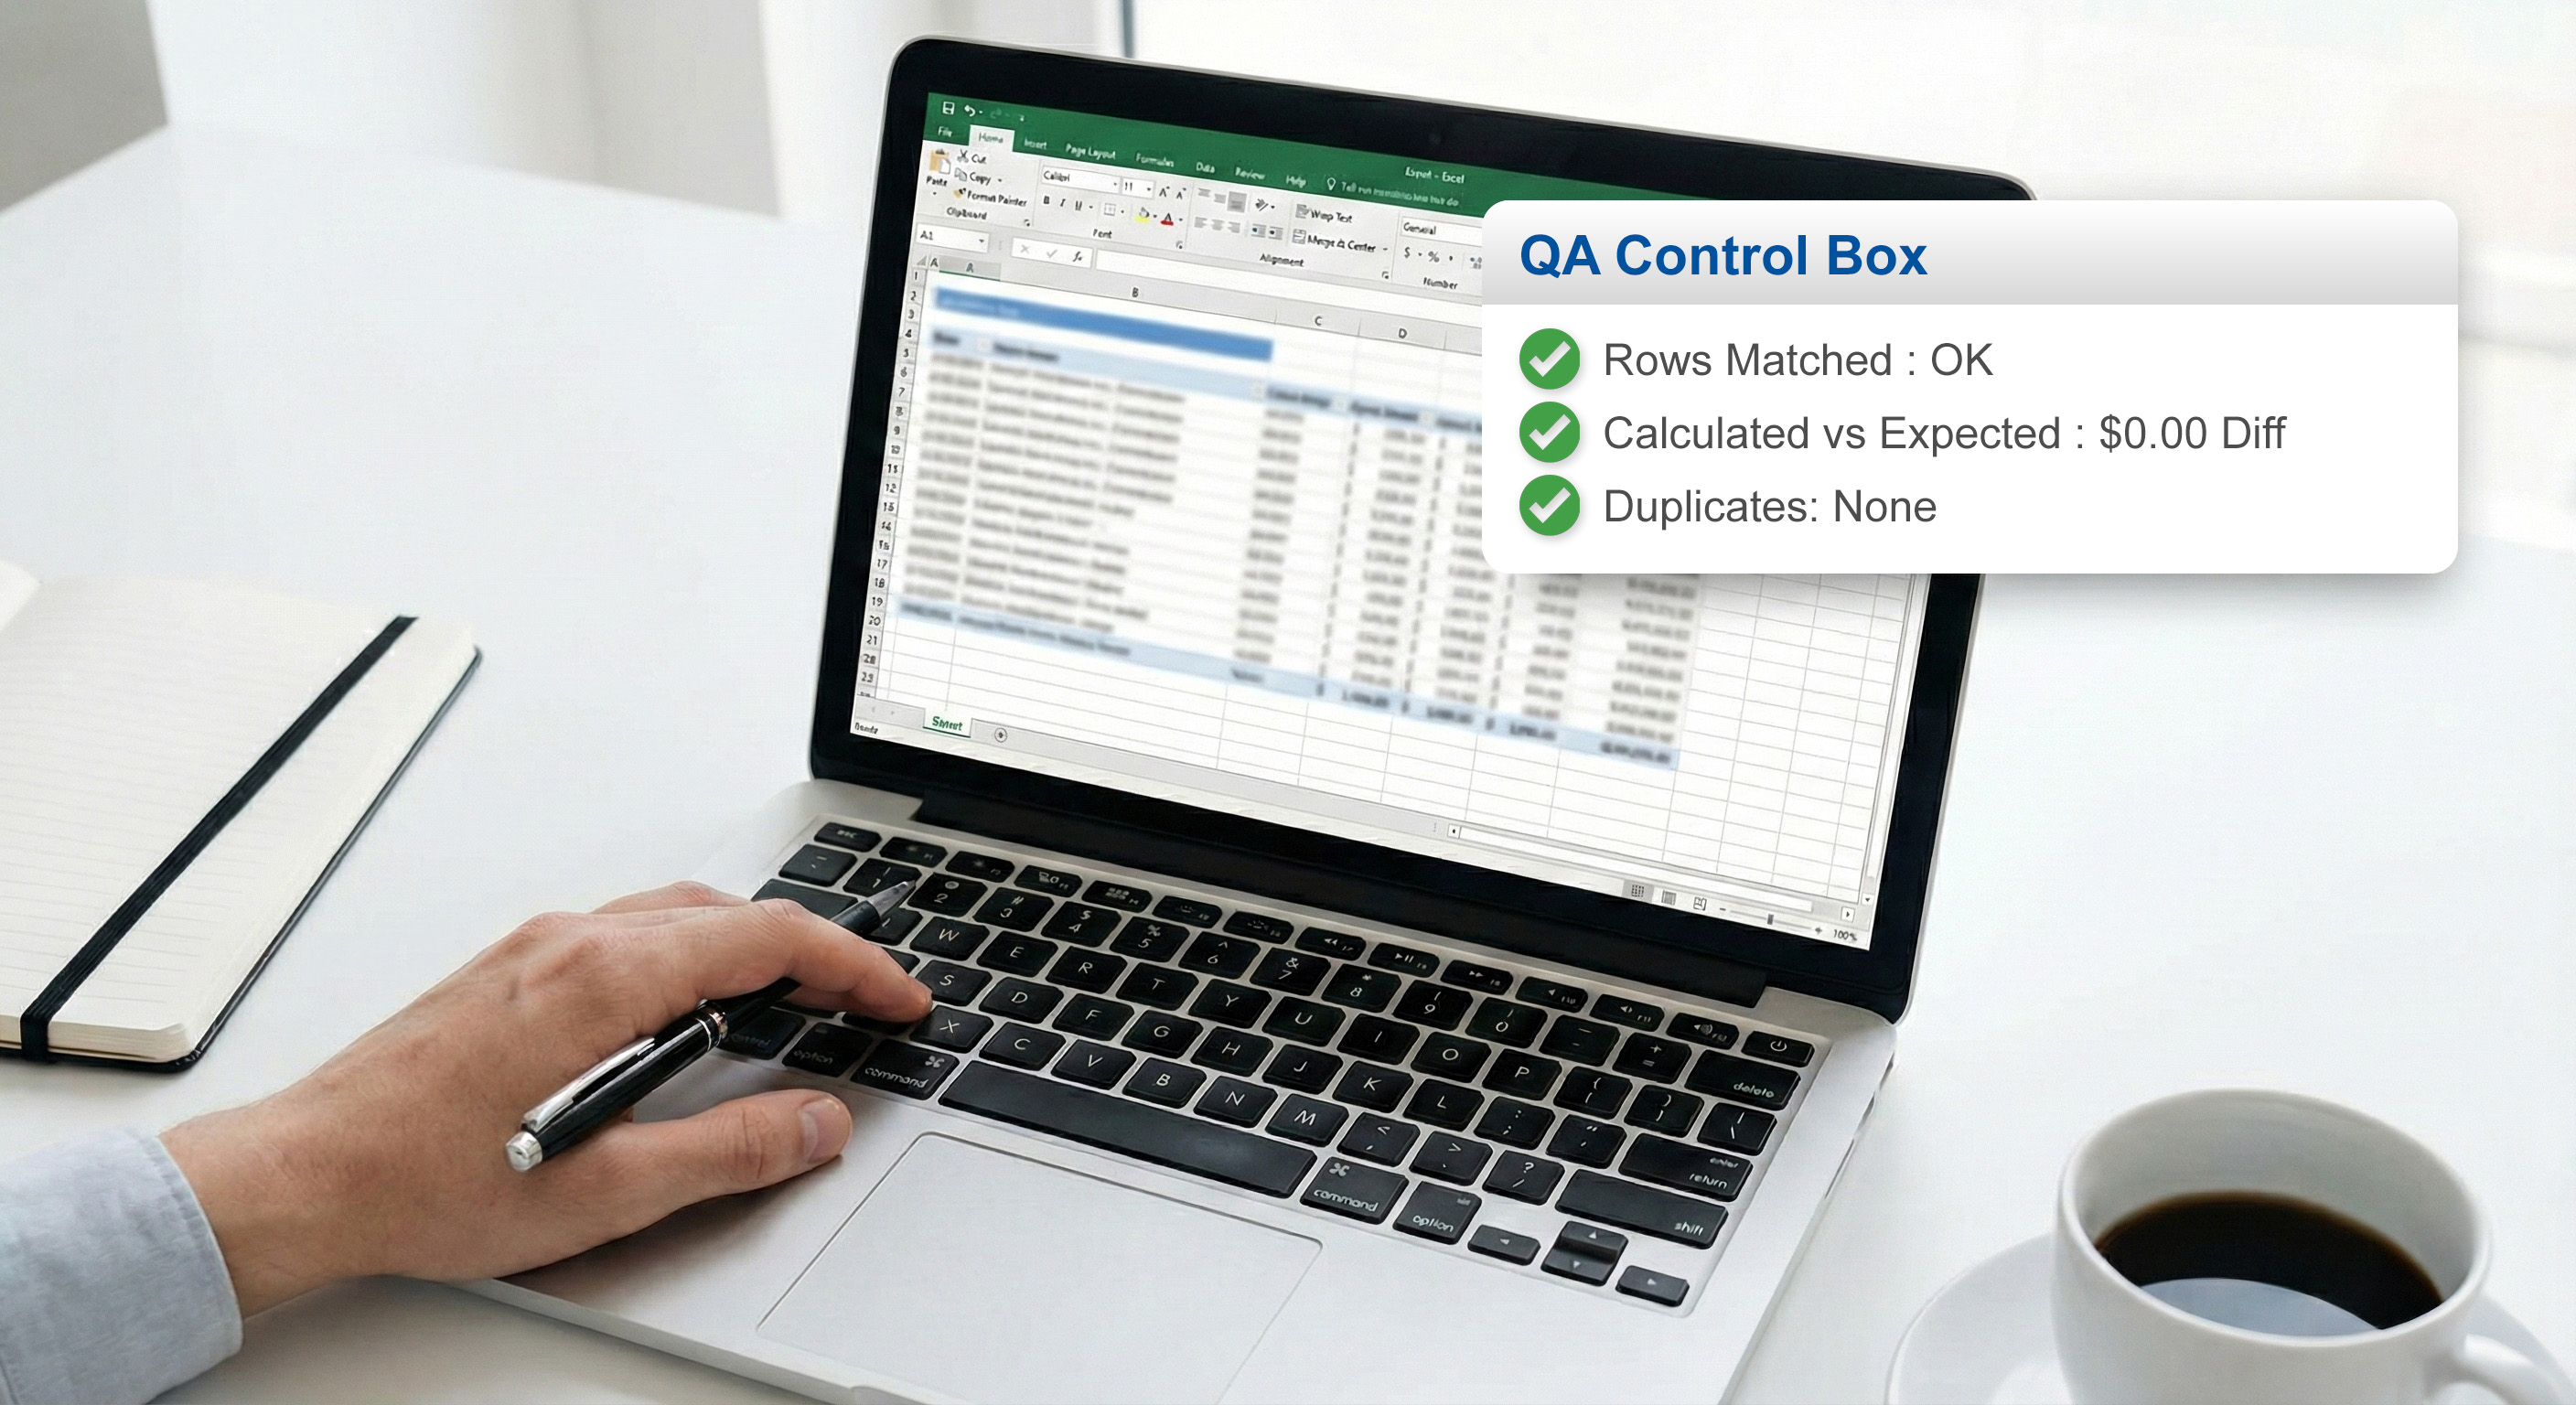
Before diving into the data, create a small "Control Box" at the top of your sheet (Rows 1–5). Freeze these rows so they are always visible. This box should summarize:
Calculated vs. Expected: A $0.00 difference check.
Row Counts: To ensure no data was dropped during export.
Duplicate Count: A quick flag for transaction IDs.
1. The Core Check: "Expected" vs. "Calculated"
The most basic check is comparing what the source document says to what Excel calculates.
Calculated Total:
=SUM(E:E)Difference:
Calculated Total - Expected Total
To make this "Audit-Ready," use a logical test that ignores tiny rounding discrepancies caused by floating-point math:
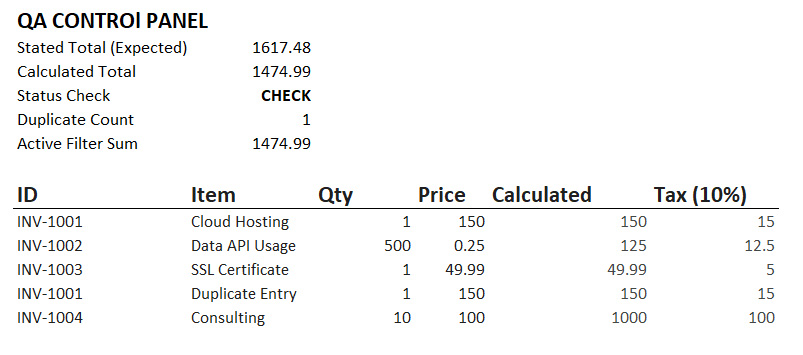
2. The Invoice Sanity Check
You’d be surprised how often shipping fees get mixed into tax or a tax column is accidentally included twice.
Calculated Tax: If a rate exists, use
=ROUND(Subtotal * TaxRate, 2)to ensure your sheet matches the penny-rounding of most ERP systems.Verify:
Calculated Subtotal + Calculated Tax + Feesmust equal theStated Total.
3. The "Dumb" Check: Counts
Counts catch missing rows or "ghost" data that SUM might miss. If you expect 42 line items and see 41, stop.
Line Item Count:
=COUNTA(DescriptionColumn)Value Count:
=COUNT(AmountColumn)
4. Detecting Duplicate Payments
This is the most important "total" in AP: Total times an invoice was paid.
To get a summary of duplicates, you can use this advanced formula:
Pro-Tip: The "double-dash" (
--) in this formula is a "coercion" tool. It tells Excel to turn TRUE/FALSE results into 1s and 0s so it can actually sum them up for you.
5. The Filtering Trap: SUBTOTAL vs. SUM
A classic mistake is filtering a table to "Approved" rows and assuming SUM() only counts what you see. It doesn't—it counts everything in the range, hidden or not. Always use SUBTOTAL for filtered views:
Filtered Sum:
=SUBTOTAL(9, E:E)
The "Done" Checklist
[ ] Calculated Total matches Expected Total (Difference is < 0.01).
[ ] Line Totals (Qty x Price) sum correctly to the subtotal.
[ ] Duplicate IDs are flagged and investigated.
[ ] Filtered Views use the
SUBTOTALfunction.
If your data starts in PDFs (invoices, POs, bank statements), you can still use every check above. The only difference is how you get the table into Excel.
If you need to extract line items from PDFs into Excel/CSV first, that’s what SendItSheets is built for. Give our extraction a try!